
Day 7: Admissions and Enrollment
A series following my new class: The Economics of Higher Education

Busy week again as we close out the semester, this time with great news! My most recent paper was published (ungated link here) and I got a new data collection in Nairobi kicked off. Huzzah!
Today’s post reflects on Day 7, 2nd Tuesday of the 3.5 week Block. On deck: Admissions (who gets into which colleges) and Enrollment (who actually goes).
Today’s readings
Bound, J., Hershbein, B., & Long, B. T. (2009). Playing the admissions game: Student reactions to increasing college competition. Journal of Economic Perspectives, 23(4), 119-146.
Nurnberg, P., Schapiro, M., & Zimmerman, D. (2012). Students choosing colleges: Understanding the matriculation decision at a highly selective private institution. Economics of Education Review, 31(1), 1-8.
Chetty, R., Deming, D. J., & Friedman, J. N. (2023). Diversifying society’s leaders? The determinants and causal effects of admission to highly selective private colleges (No. w31492). National Bureau of Economic Research Working Paper. (Abstract and Introduction)
Chetty, R., Deming, D. J., & Friedman, J. N. (2023). Diversifying society’s leaders? The determinants and causal effects of admission to highly selective private colleges (No. w31492). National Bureau of Economic Research Working Paper. (Abstract and Introduction)
Everybody but everybody has an opinion about who should get admitted into super fancy colleges. I don’t know if you’ve heard, but there have even been some lawsuits about it.
So who does get admitted, and why?
And how much does it really matter if you go to a super fancy school versus just a kinda fancy school?
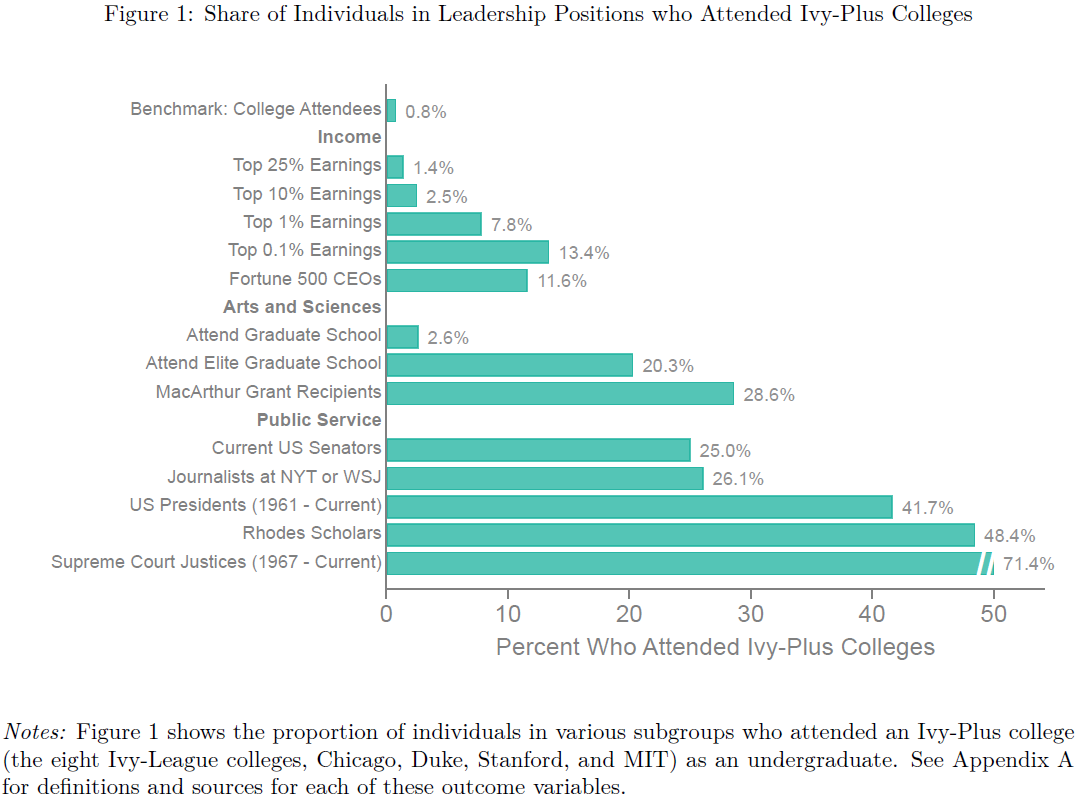
Raj Chetty and his Opportunity Insights team have written several incredibly interesting papers on the topic of education and inequality. If you haven’t seen their stuff before, do check it out. In this paper, Chetty et al. examine admission records at the 8 Ivy League Schools (Brown, Columbia, Cornell, Dartmouth, Harvard, UPenn, Princeton, and Yale) plus Chicago, Duke, MIT, and Stanford to examine which students are admitted, what factors are most determinative of admission, and whether being admitted off the waitlist at one of these schools has major effects on a student’s life later on.
First some descriptive statistics about the “elite” in America: a shockingly high fraction of people in the upper-echelons of power went to Ivy-Plus schools, including 25% of current US Senators, 42% of US Presidents, and 71% of US Supreme Court Justices.
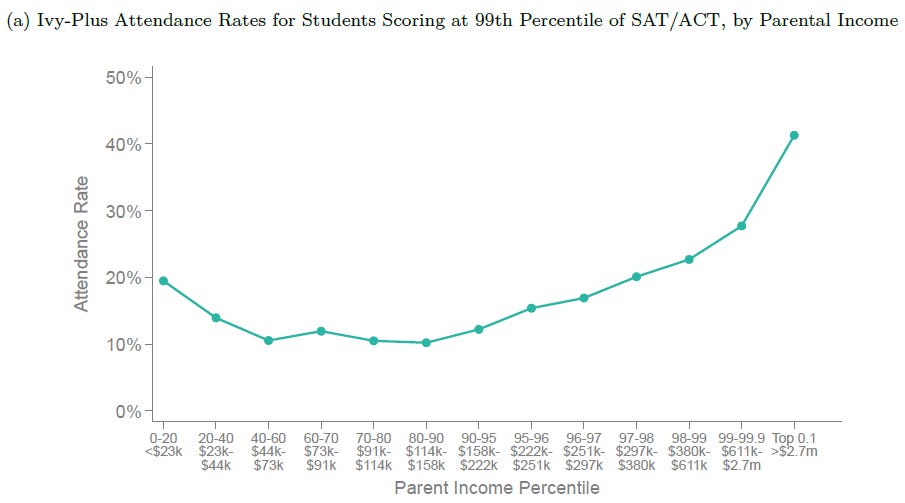
Second interesting fact: students from families in the top 1% of the income distribution are more than twice as likely to attend an Ivy-Plus school than a student from the middle class, even when both the rich student and the middle-income student both have SAT/ACT scores in the 99th percentile. The chart below plots data from the entering classes of 2010-2015.
These facts lead the authors to ask two questions: “First, how much of the disproportionate representation of students from high-income families at highly selective private colleges is driven by preferential admissions practices vs. student choices about where to apply and matriculate? Second, do such colleges have a causal effect on students’ post-college outcomes, or would the students they admit have done equally well if they had attended other colleges?”
The authors of this paper have access to essentially the best data you could ask for: college attendance data from the US Department of Education, test scores straight from the companies that administer the tests, application and admission records from several of the most selective private and public schools, and US tax records for students and their parents.
The descriptive statistics show that students from high-income families more likely to attend fancy schools, but why? Is it just that rich kids are more likely to apply to super fancy schools? That’s part of it, for sure. It’s 1/3 of the story. 1/3 of the variation in enrollment is explained by differences in application behavior. The other 2/3 of the variation is explained by admissions policies. Of that 2/3, 24% is explained by preferential treatment for athletes, 46% is preferential treatment for legacies, and the last 31% is due to “stronger non-academic credentials,” i.e. the students’ essays and the nice things people wrote in their letters of recommendation.
Sure, but isn’t this true everywhere? Nope. These patterns are not observed at the top public flagship universities (e.g. the University of Michigan, Go Blue). At the top publics, after controlling for test scores, “admissions rates are virtually identical for students from low- and high-income families at all of the highly selective public colleges we study.”
Fine. But who cares? How much does enrollment at an Ivy-Plus college really matter? A lot. The authors compare the outcomes of students who were admitted off the waitlist to an Ivy-Plus school to the outcomes for students who were on the waitlist but not admitted. This isn’t perfect causal identification, because surely the students higher on the waitlist are “better” than students lower on the waitlist. But when you zoom up exactly on those students at the cutoff, it’s pretty safe to assume that Student #121 is not terribly different from Student #122 (this is called a fuzzy regression discontinuity design). The authors find that students who just barely got in “are significantly more likely to reach the top 1% of the income distribution, attend an elite graduate school, and work at a prestigious firm.” The authors contextualize the size of the effects by estimating what would have happened had that particular student gone to their flagship public university instead of the Ivy-Plus school they barely got into. “We find that the marginal student … is about 60% more likely to reach the top 1% of the income distribution at age 33, nearly twice as likely to attend a highly-ranked graduate school, and three times as likely to work at a prestigious firm.” Importantly, they find only small effects on average income. The effects are “concentrated entirely in reaching the upper tail of the distribution, consistent with the predominance of students from such colleges in positions of leadership that motivated this study.”
It’s a lotto ticket. Getting into Harvard is a lotto ticket. It doesn’t improve outcomes most of the time, but every now and again it pays off big time. No wonder people are so pissed, and so focused on doing what they can to get their kid into Harvard.
Bound, J., Hershbein, B., & Long, B. T. (2009). Playing the admissions game: Student reactions to increasing college competition. Journal of Economic Perspectives, 23(4), 119-146.
But that’s Harvard. Who really cares about Harvard. Not very many people go to Harvard. I certainly didn’t go to Harvard. Hah-vahd.
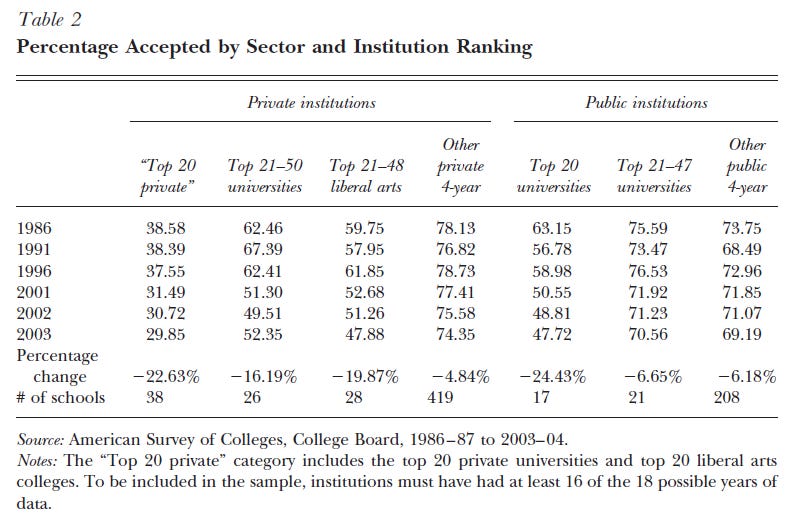
This next paper documents that it was harder to get into all types of colleges in 2004 than in 1986, not just the Ivy-Plus. The table below shows that acceptance rates fell from 39% to 30% at the Top 20 private colleges and universities, and from 63% to 48% at the Top 20 publics. Acceptance rates also fell at lower ranked schools, though not at much.
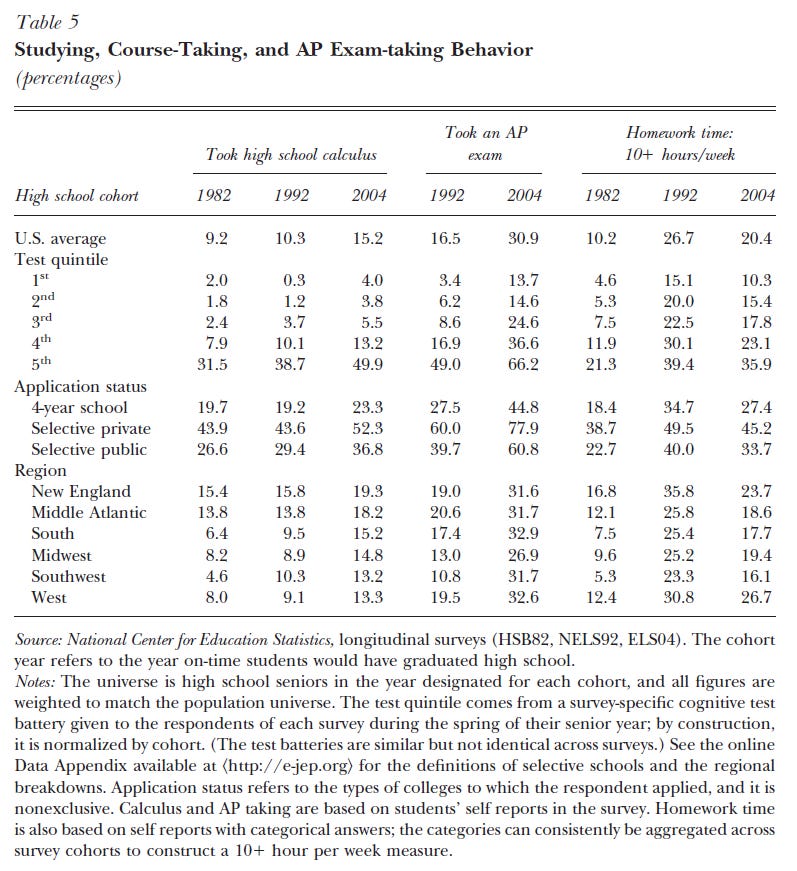
In response to these pressures, students have been upping their application game. High schoolers in the early 2000s were much more likely to take calculus in high school or take an AP exam than high schoolers in the early 1980s, especially students in the top end of the academic distribution.
Maybe kids today are just applying to more colleges, and with more AP courses, but maybe the same kind of profile would get you into the same kind of school over time.
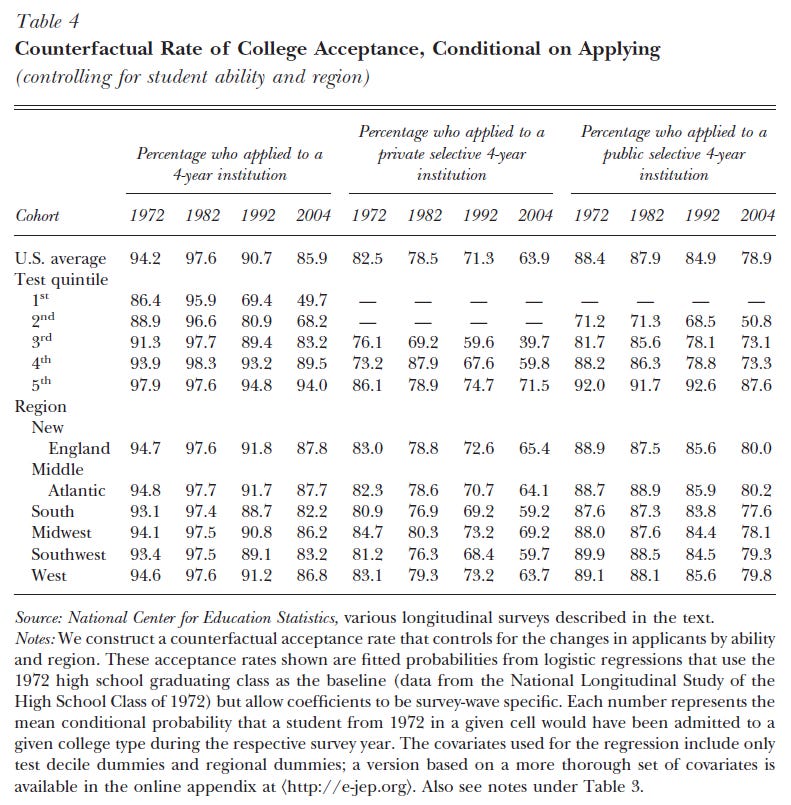
To test that theory, the authors construct a model to estimate how likely it would be for a particular student from 1972 to get in to various colleges over time. They find that it’s much more difficult to get in to college now. For example, a student in 1972 who had an SAT score in the top 20% of scores had an 86.1% chance of going to a selective private college. In 2004, that likelihood dropped to 71.5%. A student in the bottom 20% of SAT scores in 1972 had an 86.4% of going to a 4 year college overall. In 2004, that likelihood dropped to 48.7%.
All of this says to me is that it’s entirely rational for students and their parents to rachet up the pressure on “doing well” in high school. More APs. More SAT tutors. More sports. More extracurriculars. I don’t like it, but it does make sense.
Nurnberg, P., Schapiro, M., & Zimmerman, D. (2012). Students choosing colleges: Understanding the matriculation decision at a highly selective private institution. Economics of Education Review, 31(1), 1-8.
So that’s the admissions side. That’s what most people think about when they think about who goes to which colleges. But that’s not what VPs and CFOs at colleges think about most. They think about yield.
Why is yield such a big deal? Because yield = money. If you don’t get enough admitted students to say Yes to your college (especially students who are not on financial aid and are paying full price), you won’t have enough revenue to cover your expenses. But if you have too many admitted students say Yes, you’ll have more students than your infrastructure can handle. Overcrowded dorms, long waitlists for classes, students stuck in classes they’d really rather not take, etc. Over time this will lose you money too, either because you have to build new expensive “temporary” housing, or maybe students transfer out, or maybe your reputation slips and you have trouble getting enough students in the future.
Enrollment offices want to enroll precisely as many students as they target, no more, no less.
This paper estimates a “yield model” for regular admission applicants at Williams College from 2008-2012. The results show some intuitive findings and some surprising ones.
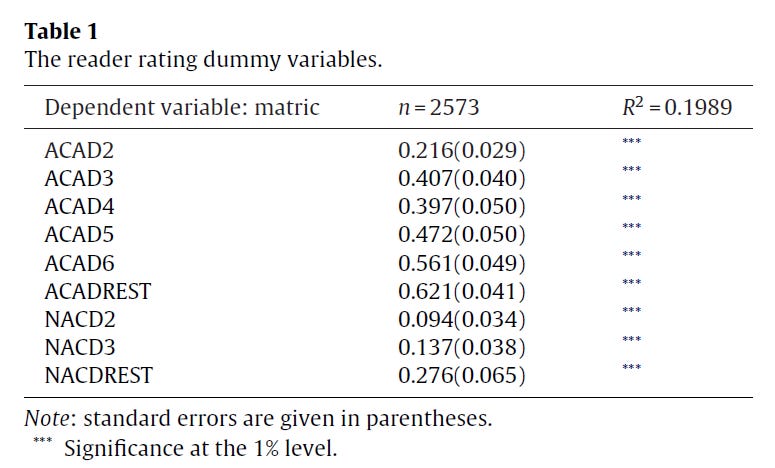
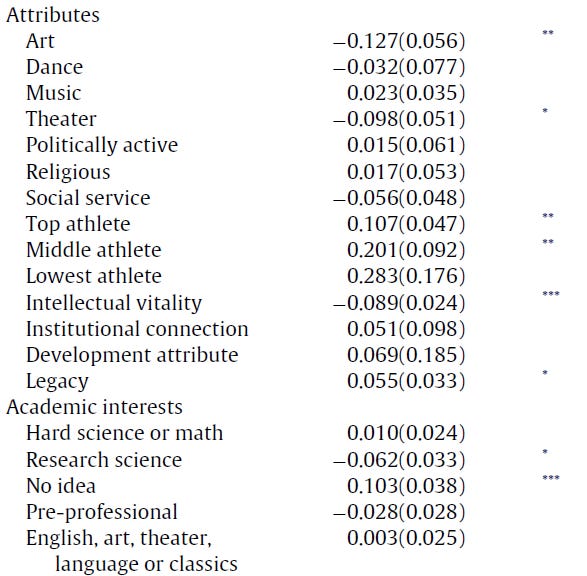
Students with higher academic and personal ratings are less likely to enroll at Williams (perhaps because they have options at other fancy schools) while students with lower academic ratings are more likely to enroll. How much more likely? The table below shows marginal effects from a Probit model. Compared to a student with the highest academic rating (ACAD1, the omitted category), students with the second highest academic rating are 21.6 percentage points more likely to accept Williams’ offer of enrollment. Students in the lowest academic rating categories (ACADREST = categories 7 - 9) are 56.1 percentage points more likely to enroll than those in the top academic category.
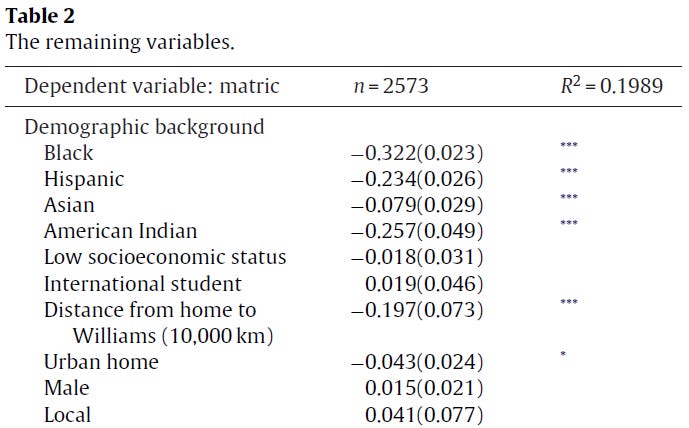
Non-white students were substantially less likely to accept an offer of enrollment from Williams. Black students 32.2 percentage points less than White students, Hispanic 23.4 percentage points less, Asian 7.9 percentage points less, and American Indian 25.7 percentage points less.
The farther away the student lives from Williams, the less likely they are to accept enrollment there. For every 1000 miles away, the likelihood of enrollment drops by 3.2 percentage points.
Students who are interested in Art, Theater, and Research Science are less likely to enroll. Top and middle athletes are more likely to enroll. (Remember how the Ivy-Pluses preference athletes in admissions? Yeah. There are reasons for that. More on that on Day 11.)
When a student’s net price (sticker price - financial aid) increases by $5000, they are 1.3 percentage points less likely to enroll. That’s a pretty small number (a low price elasticity), indicating that financial aid packages are probably pretty similar across fancy schools like Williams so that’s not going to be a deciding factor for those who have been admitted to and want to go to a fancy school. However, being denied financial aid makes it 12.4 percentage points less likely that the student enrolls. Williams has committed to meeting 100% of demonstrated student need, so families who are denied financial aid are those who believe they are less rich than Williams thinks they are. That’s gotta sting.
Overall, the variables in this yield model explains just under 20% of why an admitted student chooses to enroll at Williams College. That’s not bad, but it’s not great either. There’s still a lot of variability in who enrolls and why. The Vice President of Enrollment at Williams has a really hard job! Admit enough students that you make enough money, but not so many that you overload the dorms, and the best statistical models you have about who will come and who won’t are only 20% accurate. That’s a hard job!
Class discussion
The students had varying opinions about whether test scores should be considered at all in admissions. Several talked about the ways in which tests are not perfect measures of aptitude and ability and can be gamed by wealthy families in various ways. And as we talked about on Day 6, they don’t want to be around only the kids who do well on tests.
They definitely think the essay should be the most important part of a college application. That’s where you really find out who a person is. But they also recognize that now GenAI can do a lot of work for a writer, so the essay is becoming a less reliable signal than it used to be. Which brought us back to test scores….
This group of students was not particularly bothered by the fact that athletes get a bump in Ivy-Plus admissions. They think that extracurriculars should matter a lot. Many of them said that extracurriculars and athletics should be even more important than academic background and accomplishment. After all, the kinds of skills you develop in extracurriculars may be more related to job performance, and they think better non-academic peer effects, so shouldn’t we be upweighting those factors?
Lastly, my students were interested in discussing the ethical implications of even running yield models at all. They think that students should be admitted based on their qualifications alone, not some estimation of whether they will actually enroll. I’ll be curious to see if their perspectives change as we get deeper into talking about how colleges are businesses that must meet financial realities as well as aspire to educational goals.
And as it turns out, Finance is up next! Tune in next time for our discussion the business of liberal arts colleges.
Congrats on the pub!