
Dear Theater Major: Your program failed the Earnings Test (but we don't know what that means)
How the Do No Harm metric in the OBBB works for small programs, and why the smallest and wealthiest ones will avoid it altogether

Scene: It’s the end of summer for a rising junior Theater major at your college. He’s just finishing up his summer internship with a local actors troupe and is getting excited for school to start again. Then he gets an email from The Dean.
Dear Theater Major,
I’m writing to inform you that our Theater program has failed the Earnings Test of the One Big Beautiful Bill. While this is only a single failure and there are no immediate consequences, it is possible that our program will fail this upcoming year also and therefore you may not be able to use federal student loans to support your senior year of college. While we have every hope and expectation that our program will pass next year, we have also petitioned the Secretary of Education to allow our current majors to continue to use federal loans regardless of the outcome of next year’s test. I encourage you to speak with your major advisor and financial aid counselor if you have questions or concerns.
Sincerely,
The Dean
Letters like this one will go out in August 2027. Scary? Indeed. But what is it even talking about?
TL;DR:
The Earnings Test or “Do No Harm” metric tries to measure whether college graduates earn more money than high school graduates. If a program/major fails the test twice in three years, students in that program can no longer use federal student loans. But for some small programs the test is built on tiny samples and estimates of median earnings that bounce around a LOT, while other programs are so small they are exempted from the test altogether. I predict that many programs with true earnings well above the benchmark will be declared “failing” just based on random chance. This post and the next one try to quantify how often that might happen and how much of an earnings premium a program needs to have to reliably pass the Earnings Test.
This applies to small programs at big schools too
This Substack is usually focused on the Top 100 liberal arts colleges,1 but the issues I discuss in this series apply to all small programs no matter what type of school they’re at. If you don’t work or study at a LAC but you DO care about a major that graduates fewer than 75 students a year, please keep reading! All of this applies to you too, and the dataset I’ve made and linked to at the end probably includes your program of interest too.
What is the Earnings Test?
For many years now, people have worried that some college students and the people funding them have been getting ripped off. There are of course lots of opinions about what it means for a graduate to get “ripped off,” but one idea that has come up repeatedly is that if the Federal Government is going to provide loans for a student to enroll in a program, the Government should be assured that graduates of that program earn enough money to pay back their loans. At the very least, graduates of an undergraduate program should earn more money than people without that degree, i.e. high school graduates.
Sounds reasonable enough.
A desire for accountability in higher education has been around since at least the GI Bill (1944), and Presidents of all persuasions have tried to enact various systems to hold schools accountable through regulation. In 2025, one idea was finally codified into law by Congress. The Earnings Test, or the “Do No Harm” Metric, is one of the many things that was included in that One Big Beautiful Bill.2 Here’s how it works.
In early 2027, the Department of Education will pull 2025 earnings data from the tax returns of college graduates who finished school in 2021. They will compare the median earnings of those college graduates about 4 years after graduation to the median earnings of high school graduates aged 25-34. (Already you may see an issue: Is it fair to compare college grads with up to 4 years of work experience to high school grads with up to 7-16 years of work experience? Debatable, but that’s what was written into the law, so I guess we’ll have to go with it!) If the median earnings of graduates of a specific program are not larger than those of high school graduates then the program fails the test that year. Programs that fail for 2 of 3 consecutive years lose access to federal student loans, maybe immediately or maybe after currently declared students finish their degrees; the details have not yet been announced. If a program fails even once, students enrolled in that program must be notified of its failure.
How many programs does the Department of Education expect will fail the Earnings Test?
In January 2026 before the AHEAD rulemaking committee meeting, the Department of Education published an estimate of how many programs they predict will fail the Earnings Test: 6%.
If you look only at the Top 100 Liberal Arts Colleges in the dataset they provided, even fewer are expected to fail: only 1%.
HOWEVER, there are two major caveats to consider:
The estimates only cover 22% of programs at the Top 100 LACs. 78% of programs are not included in the estimate because those programs are so small that information was suppressed to protect individual graduates’ privacy. We have no idea what the verdict will be for the vast majority of small programs.
Even for the programs that are included, the estimates are not calculated the way the Earnings Test will actually be implemented. Maybe the true test will turn out to have similar results, but then again maybe not.
How will the Earnings Test work for small programs?
Everybody agrees that to properly evaluate a program you have to get a large enough sample of graduates’ earnings to say something meaningful about whether a specific program at a specific school is “doing no harm.” Some graduates will make more money while others make less; hopefully some of the upward variation is due to getting that specific degree, but there’s a lot of randomness in earnings too. You need a big enough sample size to be able to see the signal through the noise. Congress decided that sample size is 30.3
The OBBB states that if a program doesn’t match 30 graduates to earnings data in a given cohort, then graduates from the previous year will be added to the test. Both cohorts will be evaluated by their earnings 4 years after graduation, so the Class of ‘21 will be matched using their earnings in 2025 while the Class of ‘20 will be matched using their earnings in 2024. This aggregation across years will continue until 30 total graduates are matched to earnings data, for up to 5 cohorts.4 If after aggregating 5 cohorts a program still doesn’t have enough matched graduates, then graduates from similar programs will be aggregated together.
How do they determine which programs are “similar” enough to be pooled? Majors at colleges are classified by cipcodes, a 6 digit number that’s unique to each field of study. Cipcodes are organized such that the first two digits represent a very broad field of study (e.g. 45 is Social Sciences), the first four digits represent a more specific field of study (e.g. 45.06 is Economics), and the full six digit code is a narrow field of study (e.g. 45.0603 is Econometrics and Quantitative Economics, a.k.a. Math-Econ). The Earnings Test will start by aggregating together 5 cohorts of graduates in the 6 digit cipcode, and if that doesn’t match 30 graduates to earnings data, they try again using the 4 digit cipcode. If that doesn’t get to 30 matched graduates in 5 cohorts, they try again at the 2 digit cipcode level. If after all this aggregation across years and across programs it’s still not possible to get 30 graduates matched to earnings data, then the program is exempt from the Earnings Test.
You may have noticed that I keep saying “matched graduates,” not “graduates.” How is earnings data matched to programs? Colleges are required to report the majors and completion status of all students using Title IV funding (e.g. Pell grants and student loans) to the Department of Education each year. They use that information to connect earnings to programs. This means that the Earnings Test can only measure the earnings of graduates who used Title IV federal grants and loans to support their education. It turns out that the Department of Education is forbidden by law from trying to collect information about all students; they’re not allowed to get earnings data for all graduates even if they wanted to.5
Already right there you should be thinking to yourself “Wait, that means that students from high income/full pay families are completely excluded from these Earnings Test calculations, and that surely biases measured earnings downward because social class heritability/income correlation within families is a thing.”
Yes. And.
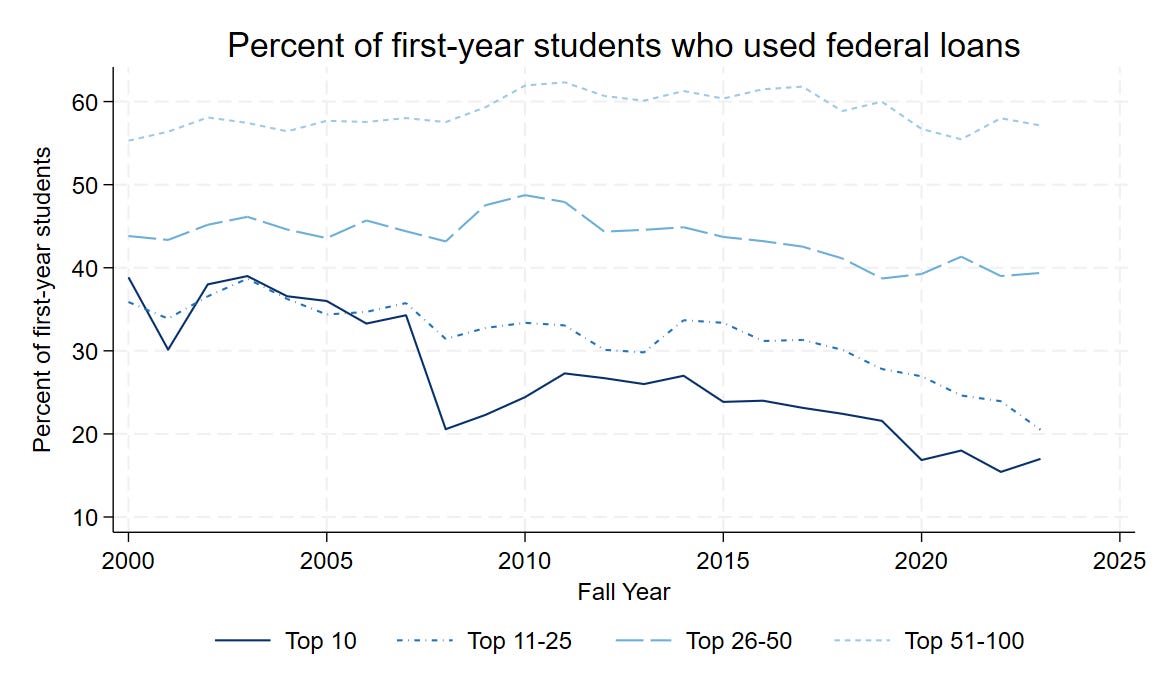
You should also be thinking that more highly ranked and well resourced schools use fewer federal student loans than other schools, so their programs are going to be evaluated differently and will probably be declared exempt more often than those at lower ranked schools. The chart below shows the percentage of first-year students at the Top 100 liberal arts colleges that used federal loans broken out by USNWR ranking tier (note that additional students may receive Pell Grants but not use loans, so this is a lower bound on the fraction of students who could be included in the Earnings Test). You can see that students who attend schools in the Top 10 are dramatically less likely to use federal loans than students in the Top 50-100. Some of this is because high income families are more likely to send their children to highly ranked schools, and some of this is because well resourced schools can afford to give more institutional grant aid. Williams made a big deal of going “no loan” in 2022. Amherst, Pomona, Swarthmore, Davidson, and Colgate all have some version of a “no loan” policy, and I’m sure other well resourced schools are also considering going “no loan” to attract students now that the Demographic Cliff is upon us.
Fewer students use loans at fancy schools, so fewer graduates can be matched to earnings. How many fewer? Let’s take a look at the Scorecard data!
The College Scorecard is a website put together during the Obama Administration to provide earnings data by college program to the public, hoping to improve accountability in higher ed. Scorecard aggregates 2 cohorts of graduates at the 4-digit cipcode level and matches to the earnings of Title IV funding recipients who are working and not enrolled in school 4 years after graduation. Information about programs that have fewer than 16 matched graduates across 2 cohorts is suppressed for privacy. This is kind of what the Earnings Test will look like for some programs, but also kind of not. In any event, this is the data the Department of Education used in January to predict how many programs will fail the Earnings Test.
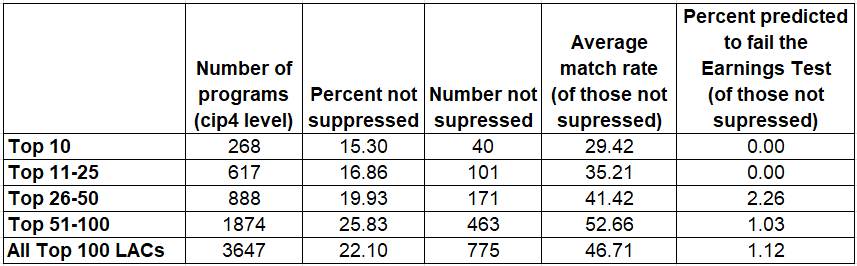
We can compare the number of matched graduates in Scorecard data to the total number of graduates reported to IPEDS to estimate what fraction of graduates and programs will be included in the Earnings Test at different schools. The table below shows information from Scorecard for the latest round of data, for ‘17 and ‘18 graduates with earnings measured in 2021 and 2022. You can see that a smaller fraction of programs at Top 10 schools are included in Scorecard data than at other schools; only 15% of programs have enough matched graduates to be included (and not suppressed for privacy) at the Top 10, while at the Top 50-100, 26% of programs are included in the data (which is still not a lot). If we look at the programs that are included in the data, 53% of graduates are matched to their earnings data at the Top 51-100 schools (because more of them use Pell grants and students loans), while at the Top 10, only 29% of graduates are matched (because fewer of them use federal funding).
Practically, this is going to mean that more programs at the Top 10 liberal arts colleges will be declared exempt and do not have to pass the Earnings Test. How many? Let’s estimate.
We don’t know exactly what the match rate will be for different programs across different schools (and it’s going to change from year to year!), but for argument’s sake suppose that ALL programs at the Top 10 have match rates of 29% and ALL programs at the Top 51-100 have match rates of 53%. We can multiply these assumed match rates by the number of graduates over the five cohorts that will be included in the first set of Earnings Tests (‘17-’21 grads), and predict the percent of programs that can be evaluated at the 6-digit cipcode level, 4-digit level, 2-digit level, and what percent will be exempt from the test altogether. That’s what’s shown in the table below.
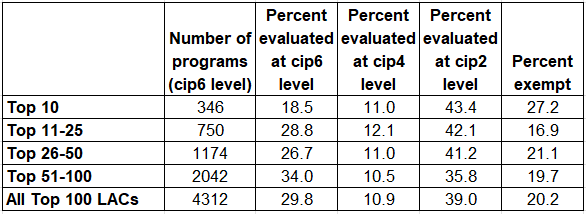
Only 19% of programs at the Top 10 will be able to be evaluated at the 6-digit level test while 27% of programs will be exempt. At the Top 51-100, 34% of programs can be evaluated at the 6-digit level and only 20% of programs will be exempt. Functionally this means different programs will be subject to different levels of scrutiny; many programs that have to pass the Earnings Test at the Top 51-100 LACs will not even be evaluated at the Top 10.
Example: The Arts at Colorado College
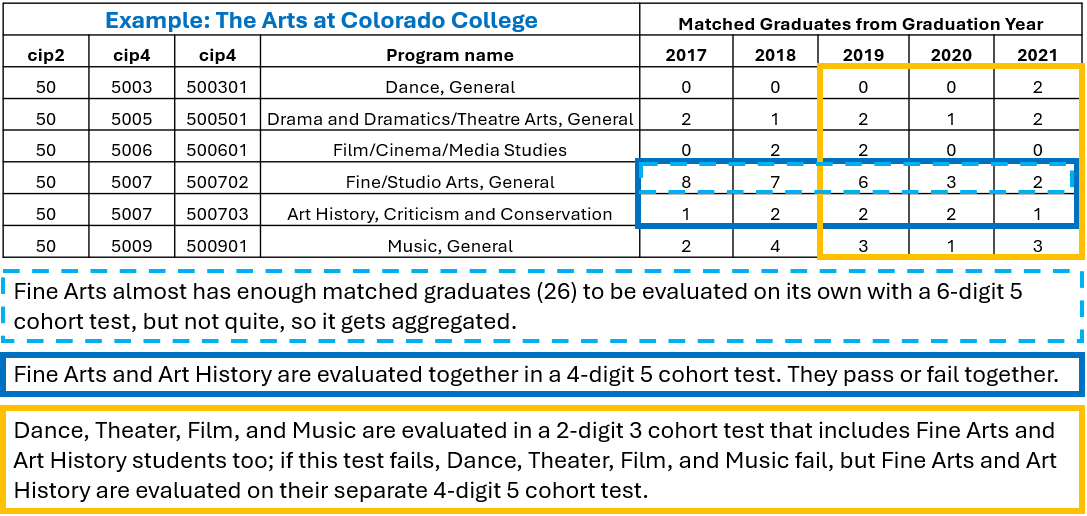
How will the aggregation and exemption actually play out at a school like mine? Let’s consider the Arts at CC, assume that 41% of graduates can be matched to their earnings, and look at the 5 cohorts of graduates that will be included in the first set of Earnings Tests. With those assumptions, Fine Arts will have 26 students matched to their earnings data across five cohorts (in the light blue dashed box in the graphic below). That’s not quite enough to satisfy the 30 matched graduates per test requirement, so Fine Arts gets aggregated up to the 4-digit cipcode level and evaluated with Art History. Together, those two programs have enough matched graduates across 5 cohorts to be evaluated (the blue box). The other programs in the 2-digit cipcode are tiny, and dispersed across codes. Dance only had 2 graduates in 2021 who could be matched to their earnings data, definitely not enough to be evaluated on their own across 5 cohorts. And because Dance is on its own in its 4-digit cipcode too, it can’t be considered at the 4-digit level and has to be aggregated up to the 2-digit level. At the 2-digit level, there’s enough matched graduates across 3 cohorts (32 students) to be evaluated there (the yellow box).
What’s a Dean to do with a Failing Test?
What should my Dean do with the results of these tests? Imagine what might happen if the 4-digit 5 cohort test for Fine Arts and Art History (blue box) passed, while the 2-digit 3 cohort test for All of the Arts (yellow box) failed. What is the Dean supposed to do with that information?
First of all, she would have to notify the students in Dance, Theater, Film, and Music that their programs are at risk of losing federal loan eligibility. She would not have to notify Fine Art or Art History majors, even though more of their graduates are included in the test that failed than the programs she does have to notify, and they may actually be the lower earners that caused the All of the Arts test to fail. Weird! And confusing. How is she going to explain that effectively to students, parents, staff, and faculty?
Second, these are tiny samples. Usually just 1 or 2 matched graduates per program per year, max 8. It would be easy to think that the failure might just be one-off bad luck. And it really could be! The measured median earnings of a small sample is going to bounce around a LOT (more on that in my next post). Maybe she shouldn’t worry about it until a test fails twice. But then again failing twice means no more federal loans, so I guess she has to worry now, even if it was just bad luck!
Third, what exactly should she do? Which program should she focus on improving? The one she suspects (but doesn’t know) has the lowest earnings? Or the one with the most graduates counted in the most tests (Fine Arts)? But that program passed, and it’s shrinking lately anyway. That reminds her, all of these tests are going to be reconfigured next year, as there are more or fewer graduates in each program, more or fewer of them got Pell grants or federal loans, more or fewer of them are working or went to grad school or moved out of the country… She can’t predict how the tests are going to be configured next year OR if they will have enough matched graduates to be evaluated at all. Hey, there’s a thought! Maybe she could try to shrink all of these programs just a touch, to slightly under 30 matched graduates across 5 cohorts, so that all of these programs will be exempt from the test. That’s what happens at Top 10 schools. That could work out fine for our programs too!
In any case, whatever the Dean does for academic programs this year won’t affect the results of the Earnings Tests for at least 5 years (the rising seniors need 1 year to finish + 4 years until their earnings are measured). Now she’s back to thinking that she shouldn’t do anything at all.
Is this really a big deal?
At this point you might be thinking one of two things:
A) “Jess is making a big deal out of nothing! The fraction of programs that are predicted to fail is really really small. Surely this won’t affect MY program.”
B) “College programs need to be evaluated somehow, and making more than the median high school graduate seems like a really low bar. Graduates from Top LACs must reliably earn more than high school graduates. Right? Surely this won’t affect MY program.”
And maybe you’re right.
But what DO you think the chance is that your program will fail even just once, so you have to send your majors that scary letter? I’ll tell you this: for many programs at Top LACs, it’s a lot higher than 1%.
And fine, college grads should reasonably expect to make more than high school grads, agreed. But how much of a premium do a program’s grads need to earn to pass the Earnings Test 95% of the time? $1000? $2000? Nope. It’s more.
In my next post I’ll show you some simulations that demonstrate that failing the Earnings Test is a considerable risk for some programs at Top LACs, and that the earnings premium a program needs to be safe is a lot more than I thought.
Subscribe now for more later!
Data for your school
By now my data nerdy readers are wishing that they could play with these data themselves. Well you are in luck! With Claude’s help I have made just the dataset you want. The Google Sheet here has two tabs, including:
Scorecard/AHEAD earnings data at the cip4 level
School name
Program name
Median earnings of graduates in ‘17+’18, measured in 2021 and 2022, inflated to 2024 $
Number of ‘17+’18 graduates matched to earnings
Total number of graduates in ‘17+’18
Coverage rate for the ’17+’18 cohorts
Benchmark for the earnings test
Standard for the earnings test (national or state median earnings for high school grads)
Earnings Test prediction (pass/fail/no data)
Median earnings of graduates in ‘14+’15, measured in 2018 and 2019, inflated to 2024 $
Number of ‘14+’15 graduates matched to earnings
Total number of graduates in ‘14+’15
Coverage rate for the ‘14+’15 cohorts
IPEDS completer data at the cip6 level
School name
Program name
Graduates in 2017
…
Graduates in 2024 (the most recent year of data released)
You can use the filters in the top row (click on the little upside down triangles) to select just one school, one program, one sector, whatever filters you want, or you can download the CSVs and use a more sophisticated analysis tool.
Happy data crunching!
In general I choose to focus on Top LACs like the one where I work just to fix some parameters so I can zoom in on others. For example, LACs don’t have hospitals; universities sometimes do; having a hospital makes reading financial statements difficult; reading financial statements is tricky enough without worrying about how having a hospital factors in, so I usually restrict my attention to schools I know don’t have hospitals.
A little basic civics reminder: Congress (the Article I section of the US Constitution) passes laws that the Executive (Article II) executes, mostly through regulation. Different Executives (a.k.a. Presidents and their Executive Branch Departments, e.g. the Department of Education) can and do interpret laws differently, so regulations can and do change frequently. Laws, however, can only be amended by Congress (or overturned, in whole or in part, by the Judiciary (Article III)), so they change infrequently. Practically, this means that the accountability systems enacted through the OBBB are a Very Big Deal because they are going to last through different Presidential administrations.
Yes, really, Congress actually did write a sample size of 30 into the One Big Beautiful Bill. Look here and search for “SEC. 84001. INELIGIBILITY BASED ON LOW EARNING OUTCOMES” to see the actual text in the statute.
The statute doesn’t specify the number of cohorts that will be aggregated. This document from the Department of Education seems to say they’re thinking about 5, but that could change in the final regulation.
The possibility of a federal student unit record system was banned by law in 2008. NAICU (National Association of Independent Colleges and Universities) persuaded members of Congress that the privacy concerns of a federal record keeping system at the student-level were too great, and an amendment was added to the Higher Education Act reauthorization bill that banned the possibility. Today, detailed student-level data for all enrolled students do exist, but they are private and not accessible to the public. Schools voluntarily submit information to the National Student Clearinghouse, a private nonprofit, and then buy information about students and other schools back from them.
The data nerd/microeconomist in me thinks it’s a crying shame that we don’t have good complete microdata available to the public, i.e. me. But then again, even as things are now US citizen students are nervous to fill out the FAFSA because they worry that information they provide might help ICE to threaten their immigrant parents. The Unitary Executive Theory is waxing in influence, so soon different agencies within the Executive Branch may be sharing more information more freely. Is that a good thing? Hmm. Tricky question.
I lived in eastern Kentucky for a while and young men would routinely work in the coal mines for high five and low six figure incomes. I’m not sure what you’ll show next week but I have a feeling that the average income for high school grads is higher than many expect!