Why the staff and faculty are so cranky
There are lots more of them, but they're not getting raises
For the last few posts, I’ve been trying to disentangle why the cost of college has increased so much. I looked at expenditures across activity categories, and showed that how money is distributed across activities hasn’t changed much since 2002. No one category is taking over. I also looked into Baumol’s cost disease, and showed that the fraction of money going to wages hasn’t increased.
So what might explain increased expenditures?
Today we’ll look in even greater detail at changes in average real wages at the top 100 liberal arts colleges, and then we’ll also look at changes in the number of employees per student, and changes in the total amount of money spent on different kinds of employees. We’re trying to see if increased expenditures are better explained by rising wages, more people, or both. We’re also looking for whether certain types of workers (managers, professors, or coaches, oh my) have a bigger influence than others, or if it’s instead increases across the board.
It’s a long and detailed post, so buckle in!
Before we look at results, we’ve got to describe the data. I’ve got two new datasets to introduce to you! Welcome to the chat, SAL-IS: Salary Outlays for Instructional Staff and SAL-NIS: Salary Outlays for Non-Instructional Staff. These datasets show the total number of people employed in different types of jobs, as well as the total outlays (money spent) on their wages. Sadly these datasets don’t start until 2012, when the Federal Government majorly updated the Standard Occupational Classification system, and the latest year of data available is for academic year 2022-2023. But hey, 10 years of data is a lot better than nothing. The datasets report both full-time and part-time workers; in this analysis, I’ll look only at full-time employees.
Instructional staff are split into: full professors, associate professors, assistant professors, instructors, and lecturers. Unfortunately, the data on assistant professors, instructors, and lecturers are not really usable. At some schools, year-long visiting professors are titled Lecturer or Instructor, so they’re reported those bins. At other schools (like mine), visitors are titled Visiting Assistant Professor, so they get lumped in with permanent tenure-track assistant professors. Because some schools do it one way and other schools another, the data aren’t comparable across schools. Boo. This is actually a big problem because any expansion in the size of a liberal arts college faculty starts with an increase in assistant professors,1 so keep in mind that these numbers can’t tell us the full story. Bummer! We’ll have to do what we can with full and associate professors.
For non-instructional staff, the major categories at liberal arts colleges are:2
librarians, curators, archivists, and academic affairs and other education services;
community, social service, legal, arts, design, entertainment, sports, and media;
office and administrative support;
computer, engineering, and science;
business and financial operations; and
management.
You may notice that there are a few kinds of staff that are missing from this list. I’ve excluded some categories because liberal arts colleges just don’t employ many people in those areas (e.g. full-time research, public service, health care). I’ve also had to exclude service jobs (i.e. food and sanitation). That’s because some schools hire their own staff to do these jobs, while others (like mine) contract it out (e.g. to Bon Apetit or Sodexo). This again makes the data on service workers incomparable across schools and therefore unusable for our purposes. Too bad.
Alright, enough with the definitions! Show me some numbers!
Let’s start by taking one last whack at the dead horse of Baumol’s cost disease. Remember, that’s the theory says the reason why college has gotten more expensive is because wages in the sector have gone up. But have they?
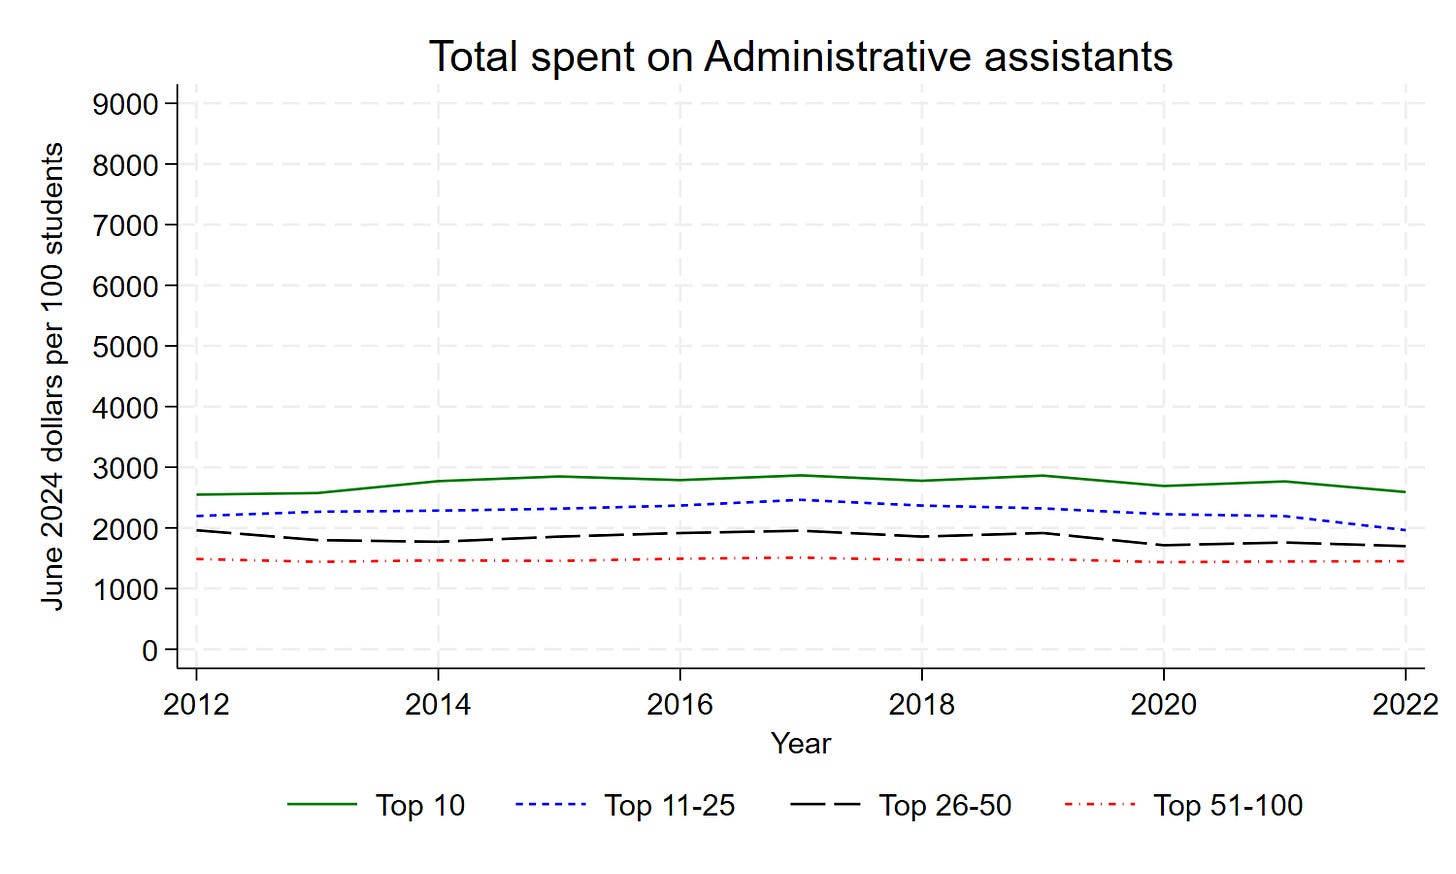
Uhhh, no, I would not say that wages at liberal arts colleges are generally increasing. This table shows the percentage increase in real (adjusted for inflation) average wages for different types of jobs from 2012 to 2022. In fact wages are falling for most types of workers! An 8.4% decrease for full professors, 4.8% decrease for associate professors, 3.5% decrease for sports and student services, 2.7% decrease for librarians and academic support specialists. And even the people who are getting raises aren’t doing all that great. For reference, according to FRED, real wages for the median college-educated worker in the US increased 9.1% from 2012 to 2022. So even the 5% increase for admin assistants and 4.6% increase for managers is worse than what the typical college graduate got over this period.
Let’s pause for a …. sigh. I guess this career really is a “calling” and not an investment.
Alright then, moving on. If wages haven’t been going up, the numbers of employees must have been increasing. And boy, have they.
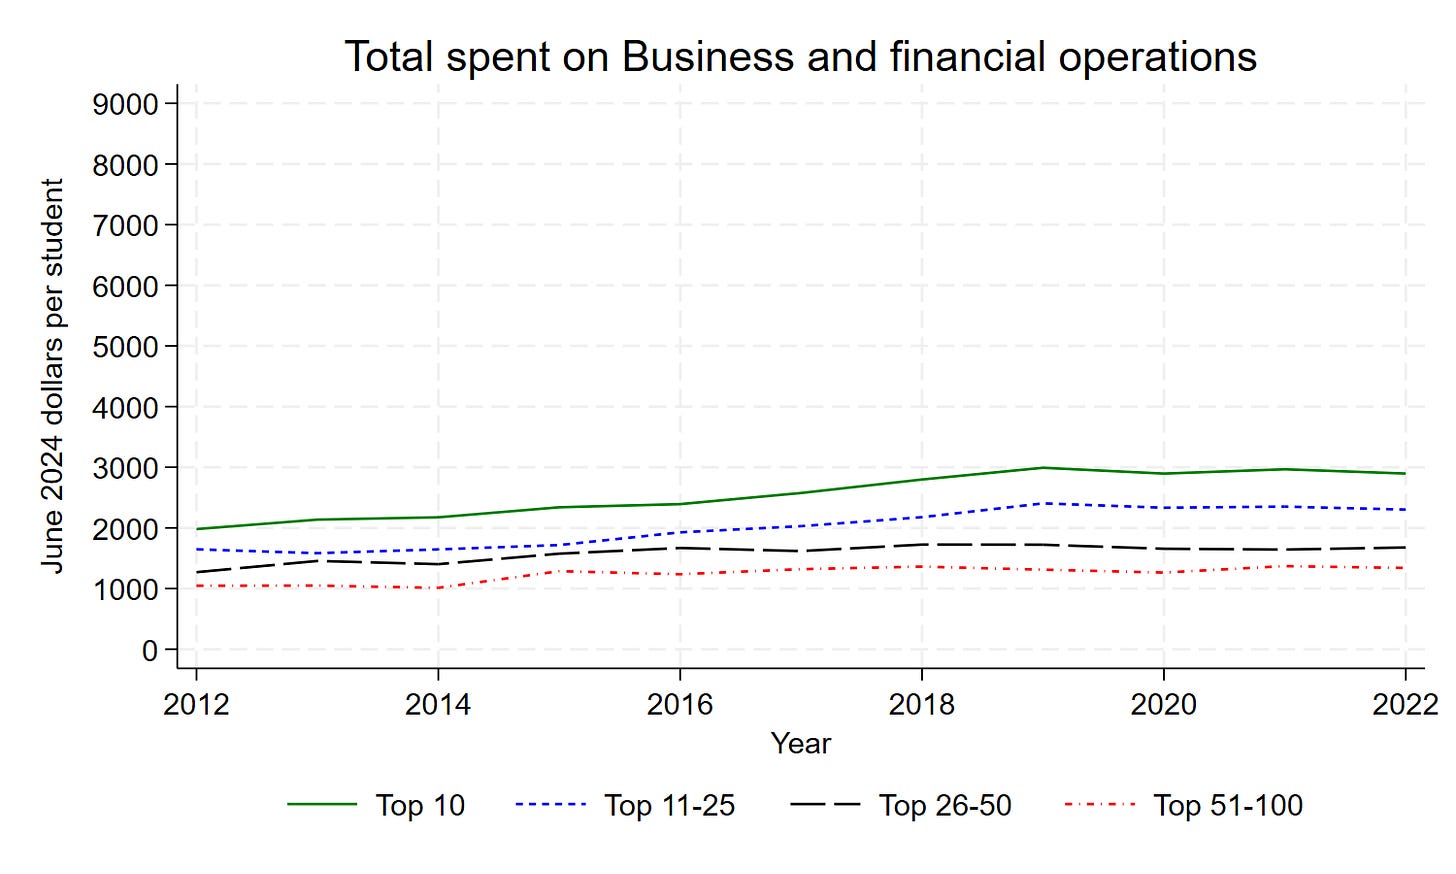
The next column of the table shows the percentage increase in the number of staff in each category, after normalizing by the size of the student body. There were 71% more librarians and academic support specialists in 2022 than in 2012 at the top 100 liberal arts colleges. There were 45% more coaches and student service employees. 32% more people in the busfin office. The only category that decreased was administrative assistants, down 11.1%.
Aside: After seeing these numbers, it is now not at all surprising that so many staff and faculty are grumpy. There’s a lot more people around competing (and complaining) for raises that just aren’t coming. That is the ideal growth medium for crank.
So wages are falling or increasing only slightly, but there’s more of pretty much every kind of employee. What does this mean for total expenditures?
The penultimate column of this table shows the percentage change in the total real wage bill for each category of worker, and the last column translates this into dollars per student.
The largest increase in total real expenditures in percentage terms is for library and academic support specialists: a 75.1% increase! And that’s after adjusting for inflation and the size of the student body! Whoa. The second largest increase is for coaches and artists (37.2%) and the third isn’t far behind (34.4% increase for the busfin office).
But the largest increase in dollar terms is not for any of those categories of workers. It’s for managers: an additional $663 per student.
Why the difference? There are a lot more managers (3.7 per hundred students) and they get paid a lot more ($140k) than writing specialists (1.6 per hundred students; $65k). Smaller percentage increases on larger bases often outrun larger percentage increases on smaller bases.
[Another aside: When I first started working on this post, I made a bunch of plots showing the number of workers per hundred students, the average real wage, and total real expenditures per student, between 2012 and 2022, by type of worker and by USNWR ranking tier. They are super interesting! But this post is too long already, so I put them in footnotes here.3 I will definitely return to them in a future post.]
Importantly, the other large increases in dollar terms were not far behind managers. Managers win this race, but it is a close one. There was a $558 per student increase spent on coaches and artists and student service employees; $447 per student for librarians and academic support specialists; $446 for the busfin office. There were much smaller increases for IT ($93) and associate professors ($20), and actual decreases for admin assistants (-$124) and full professors (-$199).
I take three things away from this analysis.
The increase in expenditures at liberal arts colleges comes from an increase in the number of almost every type of worker. It’s not just an increase in the number of lacrosse coaches, it’s increases at the Writing Center too.
It’s not increasing wages. Definitely not. So very sadly definitely not.
I’m quite surprised to see the type of worker that SLACs have not invested in: IT people. For all the hype about how technology has made the rest of the economy more productive and efficient, it kinda looks like liberal arts colleges aren’t even trying. What is up with that?
Subscribe now for more later.
It’s rare for a new professor to be hired in as an associate (tenured) or full (tenured and promoted) professor at liberal arts colleges. Most schools want to make sure you’re a good fit for their particular flavor of liberal arts, so they won’t hire you in with tenure.


Do you have an idea of why the number of staff has increased (this much)? My colleague points out that from an organizational economics point of view an org could get larger when within-org communication and coordination costs go down, which I don't think is what's going on here given that you also have total expenditure data (we know that the increase is not driven by SLACs moving in-house what they used to outsource, or do we?)
Interesting to see academic administration jobs have gone down around the country in liberal arts colleges, not just at my college.
I am surprised that librarians have increased as I know most librarians at my school don’t make the full 2080 hours. It’s become a real issue for them and turn over is high.
Also do you think the price of colleges has gone up at all because of the amount of infrastructure that is being built on campuses? New libraries and hockey arenas? I would be interested to see if there is actually an increase in building or if it has always been this way.